Your voice is like a fingerprint made of sound. No one else has the exact mix of tones that you produce. Long before smartphones existed, radio operators could recognise who was speaking just by listening carefully. Today, speech-recognition apps do something similar using maths. They look at patterns hidden inside your voice to figure out what you are saying.
In this activity, you will explore what makes your voice unique by studying the frequencies that appear when you speak different vowels.
Science Involved
Every sound you make contains a base frequency, which is the pitch. This is the lowest frequency you see on the spectrogram. If you keep your pitch the same for every vowel, this base frequency stays steady.
Above this base frequency, you see a series of copies at higher frequencies called harmonics. These show up as evenly spaced horizontal lines on the spectrogram. The spacing between these lines tells you your pitch. The strength of these harmonics changes when you move your tongue and shape your mouth. Different vowels make some harmonics stronger and others weaker, so each vowel creates its own pattern of lines on the spectrogram.
When you say a vowel, the shape of your mouth strengthens some harmonics more than others. The harmonics that get boosted together form what we call formants. Each vowel has its own formant pattern, which is why “aaa” and “eee” sound different even if the pitch is the same. Speech-recognition systems track these formants to identify the vowel you are saying.
Since each person's throat and mouth sizes are different, their tongue shape varies slightly, and they open their jaw and lips in their own way, their vowel patterns never match exactly. Even if two people say the same vowel at the same pitch, their harmonic pattern still shows small differences. These tiny variations create a voice signature which acts like an acoustic fingerprint that makes your voice unique.
Activity
Requirements
Mobile phone with Spectroid app and a quiet room.
Getting Ready
Before you start, check these basic settings in the Spectroid app. You can try adjusting them during the activity to see how the spectrogram changes.
-
FFT size: This controls how clearly you can see the frequency lines. Larger values make the lines sharper. Choose a value like 4096 or 8192.
-
Frequency axis scale (Linear vs Logarithmic): In Linear view, all frequencies are spaced evenly, which makes the harmonic pattern easy to compare, but the lower frequencies get crowded and the base frequency and formants become harder to see. In logarithmic view, the lower frequencies are stretched out, and the higher ones are squeezed together. This makes the base frequency and formants easier to spot, although the spacing between harmonics becomes less at higher frequencies. For this activity, choose Logarithmic view.
-
Peak markers: Peak markers label the strongest frequencies so you can read their values quickly. It is generally easier to read the base frequency when only one or two markers are shown.
Leave all other settings, including Sampling Rate, Decimations, Window Function, and Transform Interval, etc. at their default values.
Procedure
-
Sit in a quiet place and open Spectroid app on your phone.
-
Hold the phone about 15-20 cm from your mouth and say “म्… (mmm, like ‘hmm’)” for a few seconds. This gives you a clean base frequency to start with.
-
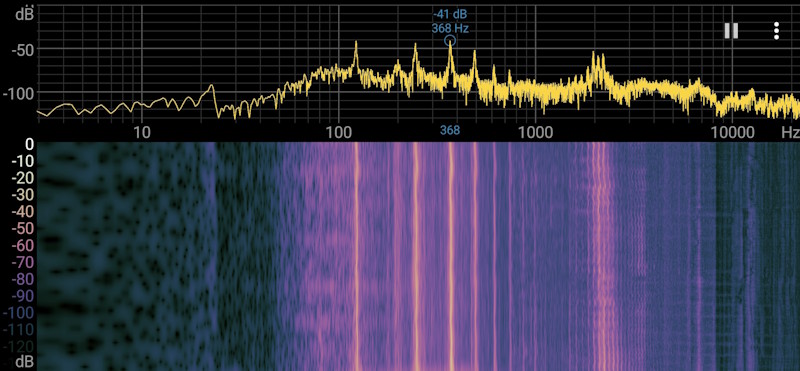
Take a screenshot of the spectrogram. In the image, you’ll see many peaks or bright lines. The base frequency is the lowest-frequency peak or bright line (the one closest to the left side). Record its value in hertz. The peaks at higher frequencies in the spectrum and the bright lines in the spectrogram are the harmonics. These have frequencies that are whole-number multiples (2×, 3×, 4×, …) of the base frequency. Note the number of prominent harmonics you can see.
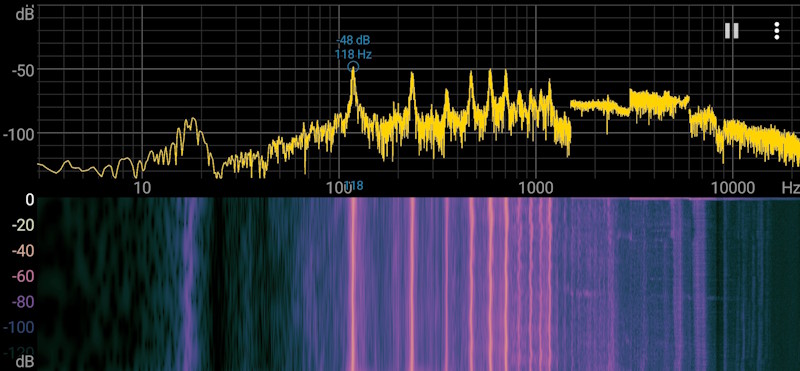
Screenshot of Spectroid app showing spectrum and spectrogram of ए. -
Look for any groups of harmonics that are stronger than the rest. These groups are the formants.
-
Now slowly move from “म्…” into the first vowel, “अ… (aah…).” Hold the vowel steadily for a few seconds and observe how the harmonic pattern changes.
-
Repeat this with the other vowels, one by one: आ…, इ…, ई…, उ…, ऊ…. Take a screenshot for each vowel so you can compare the patterns later.
-
After recording all vowels, lay the screenshots side by side or flip through them. Look for differences in which harmonics become stronger. These changes help you identify the formants for each vowel.
Observations
| Vowel (Hindi) | English Equivalent | Base Frequency | Number of Prominent Harmonics | Formant Regions (Approx. Frequency Range) |
|---|---|---|---|---|
| म् (not a vowel) | mmm (hmm) | |||
| अ | a (ago) | |||
| आ | aa (father) | |||
| इ | i (sit) | |||
| ई | ee (see) | |||
| उ | u (put) | |||
| ऊ | oo (food) | |||
| ए | ay (ate) | |||
| ऐ | ai (kite) | |||
| ओ | oh (go) | |||
| औ | aw (saw) |
Reflect and Discuss
-
Does whispering show a clear base frequency? If not, what does that tell you about how whispering is produced?
-
If you speak loudly, do the peaks become taller or do new peaks appear? What might explain this?
-
Why might the base frequency measured by the analyzer be slightly different each time you speak the same vowel or note?
-
Could two people ever have exactly the same spectrum when saying the same word?
-
If the pitch is very low, does the linear view or log view make it easier to see the base frequency? What if the pitch is very high?